

97.5%.
Sit with that number for a second.
That’s the estimated share of e-commerce store visitors who will leave in 2026 without buying anything [1]. Not most. Not the majority. Nearly all of them. And when I share that stat with operators — people running real brands with real ad budgets — the typical response is a slow nod, maybe a “yeah, conversion’s just hard right now,” and then they go right back to A/B testing their ad creative.
I find that genuinely baffling. Every time.
Because the reflex behind most e-commerce growth strategies is always upstream. More traffic. Stronger hooks. Bigger media budgets. What nobody wants to hear — what I’ve had to deliver in uncomfortable conversations more times than I can count — is that the traffic isn’t the problem. The business model underneath it is broken. And pouring more visitors into a structurally leaking bucket doesn’t fix the bucket. It just makes the floor wetter, faster.
I’ve been working with e-commerce brands for over a decade. Scrappy $800K DTC labels running entirely on gut instinct. $90M omnichannel operations with dedicated supply chain analysts who don’t yet treat the sustainable supply chain as a strategic function, and who still somehow manage to stock out of their hero SKU right before Black Friday.
The range is wide. But the pattern that shows up over and over — almost embarrassingly consistently — is this: the brands hitting a ceiling aren’t hitting it because they can’t find customers. They’re hitting it because every new customer costs more than the last one, margins are quietly deteriorating in ways that don’t surface cleanly on a P&L until it’s far too late, and the entire growth engine is running on fumes while the dashboard still looks green. The e-commerce growth strategies that got them to $5M are actively working against them at $15M.
That’s what this is about. Let’s get into it.
Why “More Traffic” Is Usually the Wrong Answer?
Growth and scaling revenue look identical from the outside — both show a line moving up — but they are not the same thing. Effective e-commerce growth strategies, the ones worth building, improve your economics over time. Scaling broken unit economics just accelerates the eventual reckoning, and the reckoning always comes.

Here’s a number that Bain & Company has been citing for years, and that subsequent research keeps confirming: a 5% improvement across the customer retention metrics that actually move profit can increase returns anywhere from 25% to 95% [2]. From a 5% retention lift. Not a product launch, not a rebrand, not a celebrity partnership. And yet the average mid-market e-commerce brand in 2026 is spending roughly $87 to acquire a new customer [3] while investing a fraction of that in keeping the ones who already exist.
I don’t say this to be harsh. I say it because the math is not subtle, and the math is being ignored at scale.
Framework 1 — Get Honest About Unit Economics First
Nothing else in your e-commerce growth strategy matters until this one is clean. And I mean genuinely clean — not “roughly 40% margin,” not a category-blended approximation. The actual Contribution Margin per Order (CMpO), broken out by channel, customer cohort, and SKU tier.
Here’s the exact process I walk brands through:
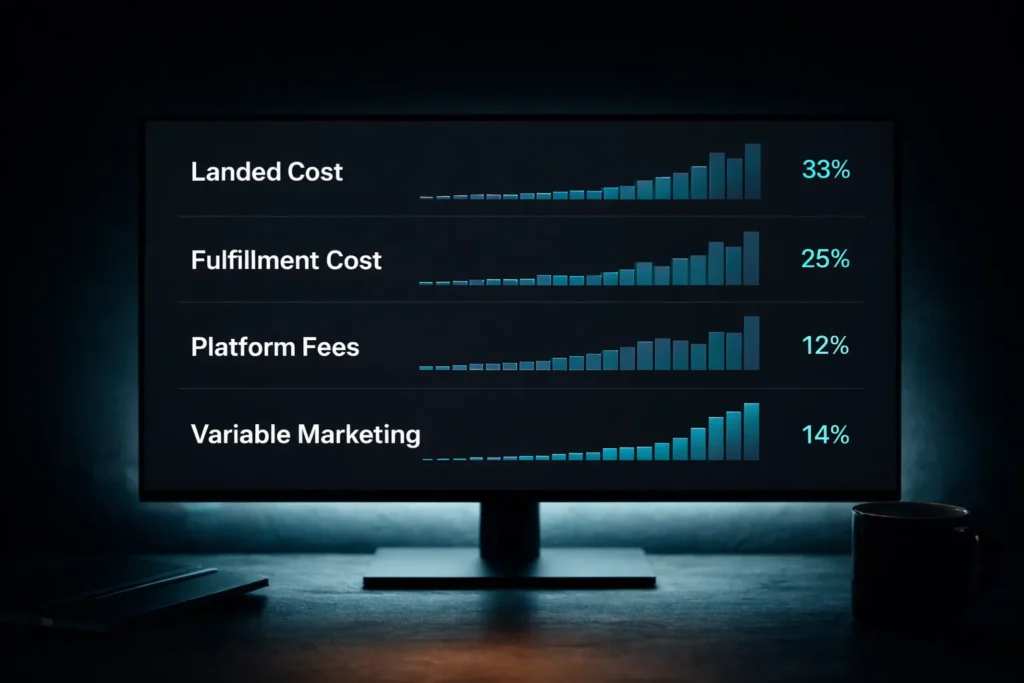
- Calculate true landed cost — product COGS, yes, but also inbound freight, port fees, duties, and 3PL receiving charges. Most brands undercount this by 8–12% because the secondary logistics costs get bucketed into overhead instead of attached to the product. That’s an accounting convenience that costs you real visibility.
- Get the real fulfillment cost per order — pick, pack, outbound shipping including dimensional weight upcharges (which carriers have been steadily tightening, and which add 15–20% to what brands naively pencil in [4]), and actual returns processing cost. Not estimates. Your real average.
- Add platform and payment fees — Shopify Plus, Stripe, any applicable marketplace fees. On a $120 AOV brand, this can be $5–7 per order, just gone. Over 50,000 orders a year that’s not rounding error.
- Subtract variable marketing cost at the order level — not blended account spend. Attributed channel cost per actual conversion. Blended CAC hides which channels are working and which are subsidizing the ones that aren’t.
What you’re left with is CMpO. If it’s negative on first purchase, you’re betting the entire business on LTV projections — and those projections need to be built from actual cohort data, not aspirational curves drawn on a whiteboard. Know your situation before you scale anything.
The Mistake That’s Quietly Killing More Brands Than People Admit
CAC optimization in isolation. It sounds like financial discipline. It feels like financial discipline. It is, in practice, one of the most dangerous things an e-commerce brand can do without context.
A low CAC on a churning customer base is worse — economically — than a high CAC on a customer who repurchases consistently over two years. That’s just arithmetic. And yet I’ve personally watched brand after brand dismantle their retention programs, freeze their loyalty initiatives, and deprioritize post-purchase experience — while quietly neglecting the sustainable supply chain improvements that would have reduced stockouts and fulfillment failures — all in the name of “improving CAC” — while their repurchase rate fell apart in the background, unnoticed, until the next board deck made it impossible to ignore.
The better metric is CAC:LTV at a fixed 12-month horizon. Not projected LTV-to-infinity (which is mostly a story brands tell themselves and their investors). Actual LTV at 12 months, from real cohorts you can verify.
The floor worth holding to: 12-month LTV should be at minimum 3x your blended CAC before you push paid acquisition hard [5]. Below that ratio, you aren’t growing — you’re widening a problem while it compounds interest.
Framework 2 — Build a Sustainable Supply Chain Before You Desperately Need One

This is where I see the most preventable disasters. No exaggeration.
A sustainable supply chain isn’t just an ESG talking point — though it’s worth noting that environmental credibility does meaningfully move purchase intent among millennial and Gen Z buyers in 2026 [6]. More practically, it’s about operational resilience. Redundancy. The structural ability to absorb a supplier disruption without your bestselling SKU going out of stock for two months heading into your highest-revenue quarter.
And yet — it still surprises me — a significant share of mid-market e-commerce brands operate with a single primary supplier for their top-revenue products [7]. One relationship. One point of catastrophic failure.
Here’s what the operators who don’t get blindsided do differently:
- They dual-source any SKU representing more than 15% of revenue. The ongoing cost of maintaining a second qualified supplier is almost always lower than the revenue loss from a single extended stockout. This is not a close call.
- They tier their buffer inventory by velocity. Fast-movers — top 20% of SKUs by order volume — carry 8–12 weeks of safety stock. Slower-moving products run leaner at 4–6 weeks. Simple. Almost nobody does it systematically.
- They negotiate landed-cost pricing, not FOB. FOB transfers freight risk to you at origin port. Given where freight rate volatility has been over the past several years, this is a meaningful exposure that too many CFOs wave off.
- They do quarterly supplier capacity audits, not annual ones. Supplier constraints build slowly, then surface all at once, usually at the worst possible time. A 30-minute quarterly call has prevented more Q4 crises than any written contingency plan I’ve ever seen.
- They’re at least stress-testing nearshoring. For apparel, accessories, consumables — regional sourcing can dramatically reduce lead time variability, which has a direct and traceable impact on working capital efficiency.
Your sustainable supply chain is infrastructure. Like most infrastructure, you notice it only when it fails.
Framework 3 — Track the Customer Retention Metrics That Actually Predict Anything
Here’s the honest version of customer retention metrics that most brands never actually reach: repurchase rate is necessary but insufficient, and email open rate has been essentially useless as a standalone metric since Apple’s Mail Privacy Protection made it unreliable. What the rigorous operators watch instead:
Purchase Frequency by Cohort. Not aggregate repurchase rate — frequency by specific acquisition cohort over 6, 12, and 24 months. This isolates whether your retention programs are working from the background noise of acquisition volume fluctuations. If your 2024 cohort repurchases at 2.1x in 12 months and your 2025 cohort is running at 1.6x, something broke. You need to find it before it affects two more cohorts.
Time Between Purchases (TBP). Average days between a customer’s Nth and N+1 order. This number determines win-back timing, which most brands get embarrassingly wrong — they send win-back campaigns at day 90 for customers whose median TBP is 47 days. That’s already too late for the majority of the audience. Deploy at day 55 and watch what happens to recovery rates.
NPS Segmented by Purchase Count. First-order NPS is almost always inflated — post-purchase rationalization, novelty bias, take your pick. Third-order NPS is something closer to the truth. That’s the number that predicts word-of-mouth, and word-of-mouth is the only acquisition channel with a $0 CPM.
Net Revenue Retention (NRR). A SaaS metric, yes, but increasingly applicable to subscription and membership-model e-commerce. NRR above 100% means your existing base is growing in revenue even without a single new acquisition factored in [8]. Below 100%, you’re running backward regardless of what your new customer numbers look like today.

These customer retention metrics, tracked on a weekly cadence and actually acted on, are what separate a brand that can reduce ad spend during a difficult quarter from one that can’t survive cutting it.
Framework 4 — Scalable Retail Infrastructure (Stress-Test It Before You Need It)
Every operator I know who built their tech stack reactively has eventually said some version of the same sentence: “I wish we’d done this six months earlier.” Without exception.
Scalable retail infrastructure is fundamentally an architectural decision, not a technology decision. And by the time you realize your OMS can’t handle current order volume, your customers are already living with the consequences — delayed fulfillments, inventory oversells, split shipments that weren’t supposed to be split — and sharing those experiences publicly in places you can’t control.

Investing in scalable retail operations early is the difference between stress-testing on your own terms and stress-testing in production. Three things worth pressure-testing before you actually need them:
Your OMS capabilities. Can it route orders across multiple fulfillment partners simultaneously? Handle split shipments without manual intervention? Reconcile returns from DTC and wholesale in the same workflow? If the honest answer involves any uncertainty, test it at 3x your peak volume now, not during a flash sale when it becomes your customers’ problem instead.
Inventory visibility latency. Near-real-time, not end-of-day batch syncs. If your inventory data is 12–24 hours stale during an influencer drop or a flash event, an oversell isn’t a risk — it’s an inevitability with a flexible timeline. Real-time visibility is table stakes at any serious operational scale.
Returns as a retention instrument. The fastest-growing brands in 2026 have figured out that a genuinely frictionless return experience drives repeat purchase behavior more reliably than a first-order discount does [9]. Your returns portal should feel like a branded touchpoint, not an apology.
Build with modular architecture wherever possible — payments, fulfillment, CRM, customer service should each be independently replaceable without forcing a system-wide rebuild. Vendors selling monolithic platforms are extracting your optionality as part of the transaction. In a market that moves as fast as e-commerce does, optionality compounds.
Framework 5 — Compound Your Channels Instead of Just Multiplying Them
Compounding channels versus renting channels. This distinction matters more than most e-commerce growth strategies give it credit for.
A renting channel — paid social being the most obvious example — stops working the moment you stop paying for it. There’s no asset accumulation, no flywheel, no residual value. You’re buying attention in discrete, non-transferable, non-appreciating units. That’s fine as a component of a channel mix. It’s a trap as the foundation of one.

Compounding channels build something that keeps working after you stop actively feeding it. The economics look worse in month one and considerably better by month eighteen.
- Owned email and SMS lists. Still the highest-ROI channel in e-commerce by a significant margin — email averaging $36 returned per $1 spent per DMA benchmarks [10]. Build this list like it’s an asset (it is), segment it aggressively, and do not let anyone on your team treat it like a broadcast channel.
- Organic search and content authority. Slow to build. Genuinely hard to replicate once established. A well-ranked piece of content generates traffic at effectively zero CAC indefinitely. That’s a fundamentally different economic character than any media buy.
- Community and real loyalty mechanics. Programs built around genuine engagement — not points-for-purchases, which is structurally just a delayed discount with extra steps — create social proof loops that reduce acquisition cost organically. Gymshark invested in community long before their paid was profitable. That wasn’t an accident; it was a strategy.
- Wholesale and retail partnerships. Chronically underestimated by DTC-native brands. The right wholesale account can function as a customer acquisition channel with economics that rival your best-performing paid campaigns — and you’re not running the media buying.
TikTok Shop, Google Shopping, Amazon — they’re not on this list as anchors. Not because they can’t work, but because channels you don’t own can restructure their algorithms, change their terms, or restrict your category without notice. Supplement with them. Don’t build your foundation on them.
In My Experience: The Real Differentiator Nobody Talks About Enough

I’ll be straightforward here — the operators building genuinely durable businesses aren’t smarter than the ones plateauing. They don’t have a secret supplier, a proprietary acquisition channel, or some creative genius their competitors lack. What they have is a commitment to doing unglamorous things before those things become urgent.
They modeled unit economics before they scaled spend. They built a sustainable supply chain and supplier redundancy before a disruption ever forced their hand. They tracked customer retention metrics and invested in retention infrastructure when those numbers weren’t technically broken yet. They built for scalable retail by stress-testing their OMS before order volume exposed the gaps. And every time, the people around them thought they were being cautious to the point of timidity.
They were right, and the cautious ones won.
The second differentiator — and this one tends to land uncomfortably — is data honesty. The brands that plateau are almost always operating on a story their data doesn’t actually support. Their “loyal” cohorts aren’t loyal by the numbers. Their attribution model is giving credit to channels that aren’t generating the revenue it shows. Their LTV projections assume retention curves they’ve never achieved in a single real cohort.
Getting honest about what the numbers actually say — especially the uncomfortable ones — is most of the job. Not in a quarterly post-mortem. Every week.
The cadence I’ve seen work consistently across wildly different business sizes: a weekly unit economics review at the leadership level. Thirty minutes. Someone owns CMpO, CAC:LTV ratio, and cohort retention. They report it in plain language with no polish. When those numbers become part of the operational heartbeat rather than a quarterly reckoning, decision-making quality improves faster than most leaders expect. Not gradually. Fast.
This Is a System. Act Accordingly.

These five frameworks don’t operate in isolation — that’s the point. Clean unit economics free up capital to invest in supply chain resilience. A sustainable supply chain improves fulfillment consistency, which improves the customer experience, which feeds directly into your customer retention metrics. Strong retention reduces your CAC:LTV pressure, which means you can invest in compounding channels instead of perpetually feeding a paid acquisition machine that never builds equity. Scalable retail infrastructure means none of it fractures when real growth arrives.
The return on building this system is not linear. Once enough components are in place, each one amplifies the others — and that kind of compounding creates moats that are genuinely difficult for competitors to replicate quickly.
Start with Framework 1. Go deep on it for 90 days. The gravitational pull toward spreading thin across all five e-commerce growth strategies simultaneously is real, and it will cost you. Depth beats breadth here, almost without exception.
That’s not a hedge. That’s the lesson that keeps showing up — in e-commerce growth strategies, in supply chain decisions, in retention programs — across brand after brand, at scale after scale.
FAQs
Why do most e-commerce growth strategies fail to scale past $10M?
How does a sustainable supply chain impact my bottom line?
Which customer retention metrics actually matter in 2026?
What is the “golden ratio” for CAC and LTV?
How can I tell if my retail infrastructure is truly scalable?
Why is Net Revenue Retention (NRR) being used in e-commerce?
What are “compounding channels” and why do they beat paid ads?
How do I transition to a more resilient sourcing model?
▶ Sources and References
Have a question about applying any of this to your specific model? Leave it in the comments — I read every one.